
Analysis of Dairy Sheep Production Survey 2019 Results
Here is an overview of the results for 2019 North American sheep milk production:
On average, the 20 survey participants each milked 139 ewes for 203 days in 2019, resulting in a total of 1,320,303lbs of milk produced. Of the 20 participants, 7 were Canadian producers, and 13 were U.S. producers.
There were three systems of weaning lambs.
Wean lambs and begin milking at day 1-3 after lambs are born (11 participants)
Wean lambs and begin milking at day 30 after lambs are born (6 participants)
A mixed/semi-suckling system (2 participants)
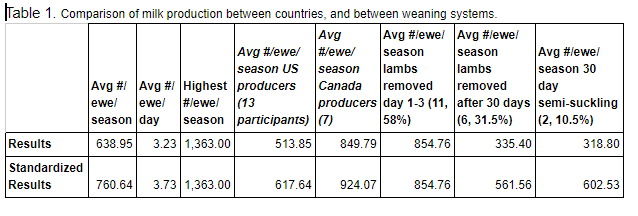
To standardize milk production across management systems for better comparison, dairies that followed management practices 2 or 3 had milk amounts added to account for the milk consumed by the lambs during the time on their dams. For lambs on dams for the 1st 30 days, it was assumed that the ewes had twins on average, and that each lamb consumed 130# of milk during this time. For lambs on a mixed/semi-suckling system, it was assumed that there was an 89% difference in milk production during the first 30 days between this system and removing lambs at day 1-3. These standardization numbers were derived from data on DSANA’s website.
The overall average pounds of milk produced per ewe per season was 761lbs. The U.S. producers were below the average, at 618lbs, and Canadian producers were above the average, at 924lbs. This difference in production between Canadian and U.S. sheep dairies could possibly be attributed to Canada’s longer history of genetic improvement programs for dairy sheep.
Waiting until lambs were 30 days old to begin milking or using a semi-suckling system dropped the average milk produced per ewe per season from 855lbs when lambs are removed during the first 3 days to 562lbs and 603lbs respectively.
Only 16% of participants did not measure individual ewe production at all. Interestingly, the producers that did not measure milk production at all had more pounds of milk per ewe per season (1,059lbs) than those that did measure (702lbs), but the results are not significant, since only three participants do not meter at all. 58% of producers are not currently taking individual milk samples for component analysis, and 70% of producers are not having their production data statistically analyzed. However, 73% of participants who were not already metering and receiving genetic merit information said that they would like to receive guidance on metering and/or genetic potential of their stock. Tables 2 and 3 show the ways in which producers measure individual ewe production.

Sheep and Goat Dairy Market Conditions and Consumer Research
Northeast Dairy Business Innovation Center
A report titled Sheep and Goat Dairy Market Conditions and Consumer Research has recently been released. The report is the result of a consumer survey on sheep and goat dairy product consumption in the Northeast of the US, commissioned by the Northeast Dairy Business Innovation Center. It is a pretty long report, coming in at 77 pages, and as service to the DSANA newsletter readership, we have pulled out a few tidbits worthy of note or thought. The link to the full report is included at the end.
The body of the report was the results of the survey of 600 random consumers throughout the eight Northeast states (all six New England states + NY & NJ).
Some good news for dairy sheep producers: Many of those who tried sheep products indicated they liked them (55% for those who had tried fluid sheep milk; 70% for those who had tried sheep milk yogurt or cheese). Respondents appeared to like goat milk less, with an average of only 44% of those trying the product liking it. Goat cheese and yogurt had higher ratings of liking of 58% and 63%, respectively.
And here is perhaps a real challenge for sheep-milk producers: in the Northeast states in the US, where dairy sheep operations and products have been present for about 20 years, most consumers don’t realize the products exist or are available. From the report:
Many other factors (i.e., other than price or demographics) which could affect purchasing decisions were assessed, including perceived availability, label information, sampling, and familiarity with dairy operations.
Among those who do not purchase sheep or goat dairy, few believe these products are available for purchase, with the exception of goat cheese.
About 48% of respondents perceive goat cheese as available. In comparison, 19% believe sheep cheese is available.
Goat and sheep yogurt were perceived as being least available, with only 4% and 9% of respondents reporting sheep and goat yogurt as being available to purchase, respectively.
Sampling may help drive sales of sheep and goat dairy products. Among those who have sampled these products in stores, over half indicated they went on to purchase the milk products they sampled, while one-third purchased the cheese they sampled (see figure below).
When assessing labels, most respondents indicated that they do not have a preference when it comes to the level of detail regarding geographic origin contained on labels (although about one-quarter did prefer to see state-level information on the labels).
Respondents were generally unfamiliar with the dairy operations that produce the products they purchase, with no more than 25% of respondents familiar with dairy operations producing their cheese, milk, or yogurt products.
On this point, the researchers concluded that “Offering samples can improve consumer awareness and help drive sales of sheep and goat dairy products.”

The report also included data on general dairy product consumption (cow, goat, and sheep) in the eight Northeast states (all six New England states + NY & NJ) in all types of retail locations, from supermarkets and convenience stores to farmers markets and home delivery.
Here are a couple of points that might be food for thought when considering where to put your marketing efforts or which market to put your finite time and resources into.
Home delivery is a method many producers are shifting to, but the success may be limited to one’s access to a urban or suburban market: the dollars spent on dairy product through home delivery is significantly higher in the more populous and suburban states (NY, NJ); in the less populous and suburban states (such as Maine, NH, and Vermont), dairy product purchases through home delivery did not differ at all from farmers markets.
Yogurt consumption (regardless of species) is much much higher in the 18-44 age group than in the 45-64 or 65+ age groups. Perhaps not a big surprise. More interesting is that income level does not change yogurt consumption. But this is perhaps worthy of note and of thought: the average monthly spending on yogurt is $38.70 in households with kids, and only $4.80 in households without kids.
Link to full survey: https://agriculture.vermont.gov/dbic/activities/goat-sheep-dairy-market-research